Datapoint#
- class c4dynamics.states.lib.datapoint.datapoint(x=0.0, y=0.0, z=0.0, vx=0.0, vy=0.0, vz=0.0)[source]#
A data-point object.
The
datapointis the most basic element in translational dynamics; it’s a point in space with the following state vector:\[X = [x, y, z, v_x, v_y, v_z]^T\]Position coordinates, velocity coordinates.
As such, each one of the state variables is a parameter whose value determines its initial conditions:
Arguments
- xfloat or int, optional
The initial x-position of the datapoint. Default value \(x = 0\).
- yfloat or int, optional
The initial y-position of the datapoint. Default value \(y = 0\).
- zfloat or int, optional
The initial z-position of the datapoint. Default value \(z = 0\).
- vxfloat or int, optional
The initial x-velocity of the datapoint. Default value \(v_x = 0\).
- vyfloat or int, optional
The initial y-velocity of the datapoint. Default value \(v_y = 0\).
- vzfloat or int, optional
The initial z-velocity of the datapoint. Default value \(v_z = 0\).
The input arguments determine the initial values of the instance. The vector of initial conditions can be retrieved by calling
datapoint.X0:>>> from c4dynamics import datapoint >>> dp = datapoint(x = 1000, vx = -100) >>> print(dp.X0) [1000 0 0 -100 0 0]
When the initial values are not known at the stage of constructing the state object, it’s possible to pass zeros and override them later by direct assignment of the state variable with a 0 suffix. See more at
X0.- Parameters:
mass (float) – The mass of the datapoint
Example
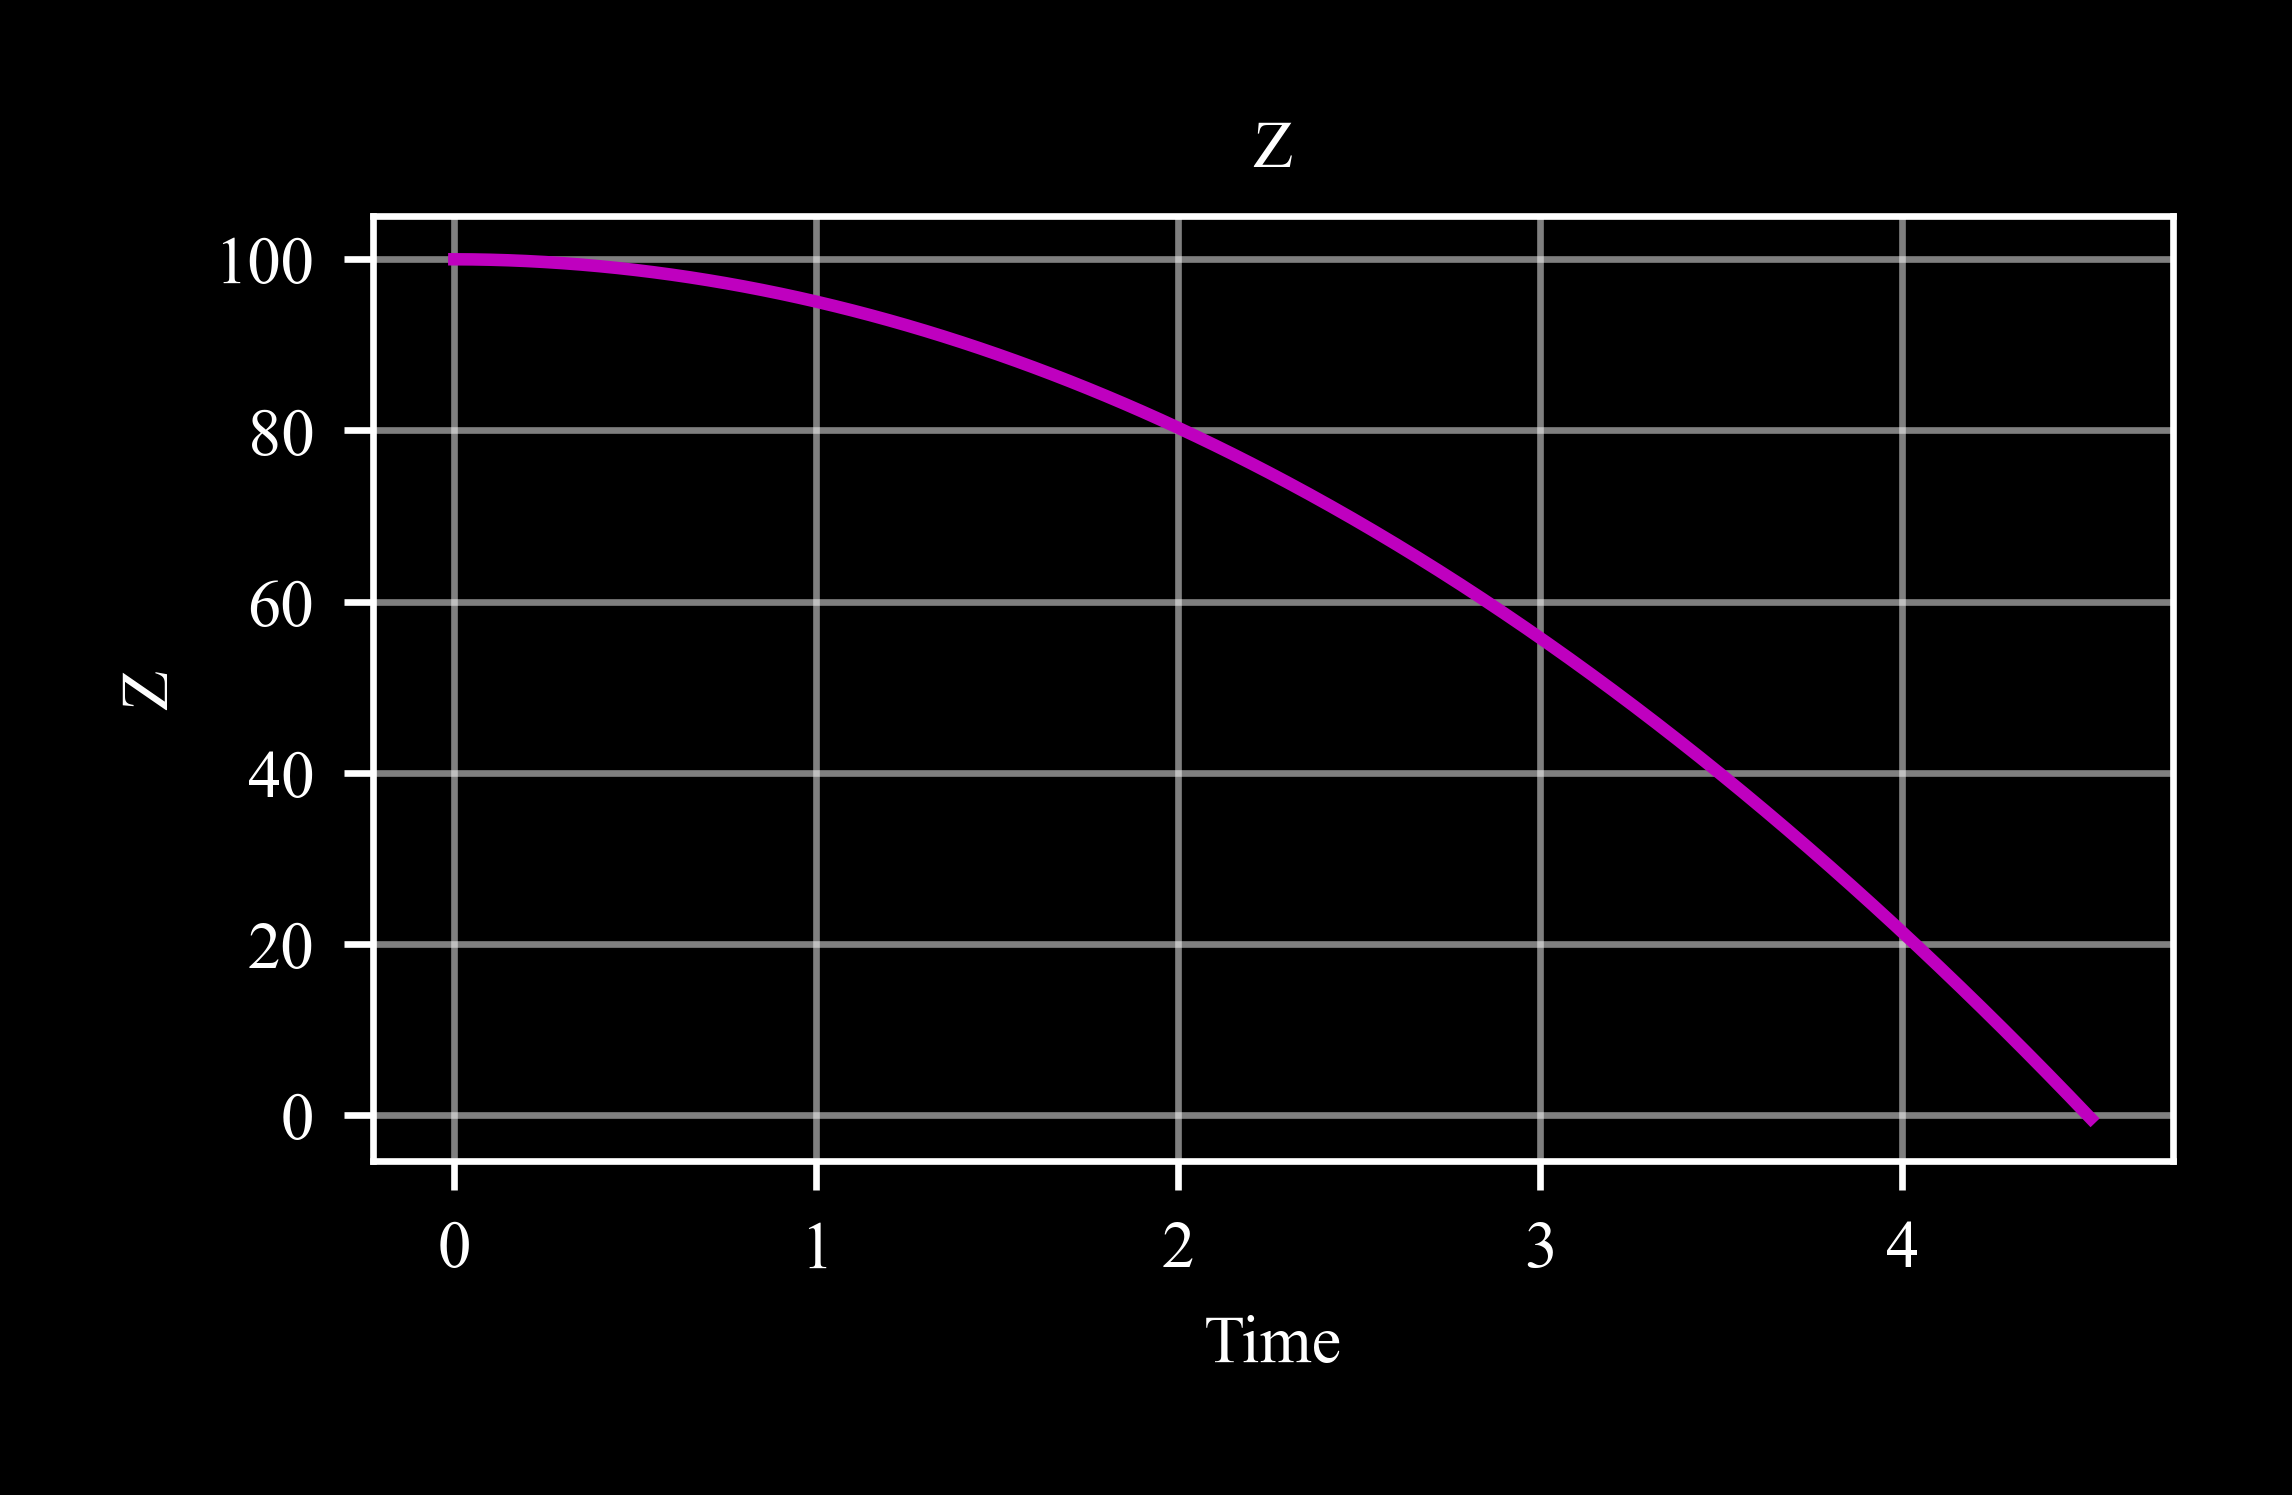
The following example simulates the motion of a body in a free fall.
The example employs the
eqmmodule to solve the equations of motion of a point-mass in the three dimensional space, and integrate them using the fourth-order Runge-Kutta method.Import required packages:
>>> import c4dynamics as c4d
>>> from matplotlib import pyplot as plt
>>> import numpy as np
Settings and initial conditions:
>>> dp = c4d.datapoint(z = 100)
>>> dt = 1e-2
>>> t = np.arange(0, 10 + dt, dt)
Main loop:
>>> for ti in t:
...   dp.store(ti)
...   if dp.z < 0: break
...   dp.inteqm([0, 0, -c4d.g_ms2], dt)
>>> dp.plot('z')
Properties
Gets and sets the object's mass.
Methods
datapoint.inteqm(forces, dt)Advances the state vector
datapoint.X, with respect to the input forces on a single step of time, dt.datapoint.plot(var[, scale, ax, filename, ...])Draws plots of trajectories or variable evolution over time.