c4dynamics.detectors.yolo3_opencv.yolov3.detect#
- yolov3.detect(frame: ndarray) list[pixelpoint][source]#
Detects objects in a frame using the YOLOv3 model.
At each call, the detector performs the following steps:
Preprocesses the frame by creating a blob, normalizing pixel values, and swapping Red and Blue channels.
Sets input to the YOLOv3 model and performs a forward pass to obtain detections.
Extracts detected objects based on a confidence threshold, calculates bounding box coordinates, and filters results using Non-Maximum Suppression (NMS).
- Parameters:
frame (numpy.array) – An input frame for object detection.
- Returns:
out (list[pixelpoint]) – A list of
pixelpointobjects representing detected objects, each containing bounding box coordinates and class label.
Examples
Setup
Import required packages:
>>> import cv2  # opencv-python
>>> import c4dynamics as c4d
>>> from matplotlib import pyplot as plt
Fetch ‘planes.png’ and ‘aerobatics.mp4’ using the c4dynamics’ datasets module (see
c4dynamics.datasets):>>> impath = c4d.datasets.image('planes') Fetched successfully >>> vidpath = c4d.datasets.video('aerobatics') Fetched successfully
Load YOLOv3 detector:
>>> yolo3 = c4d.detectors.yolov3()
Fetched successfully
Let the auxiliary function:
>>> def ptup(n): return '(' + str(n[0]) + ', ' + str(n[1]) + ')'
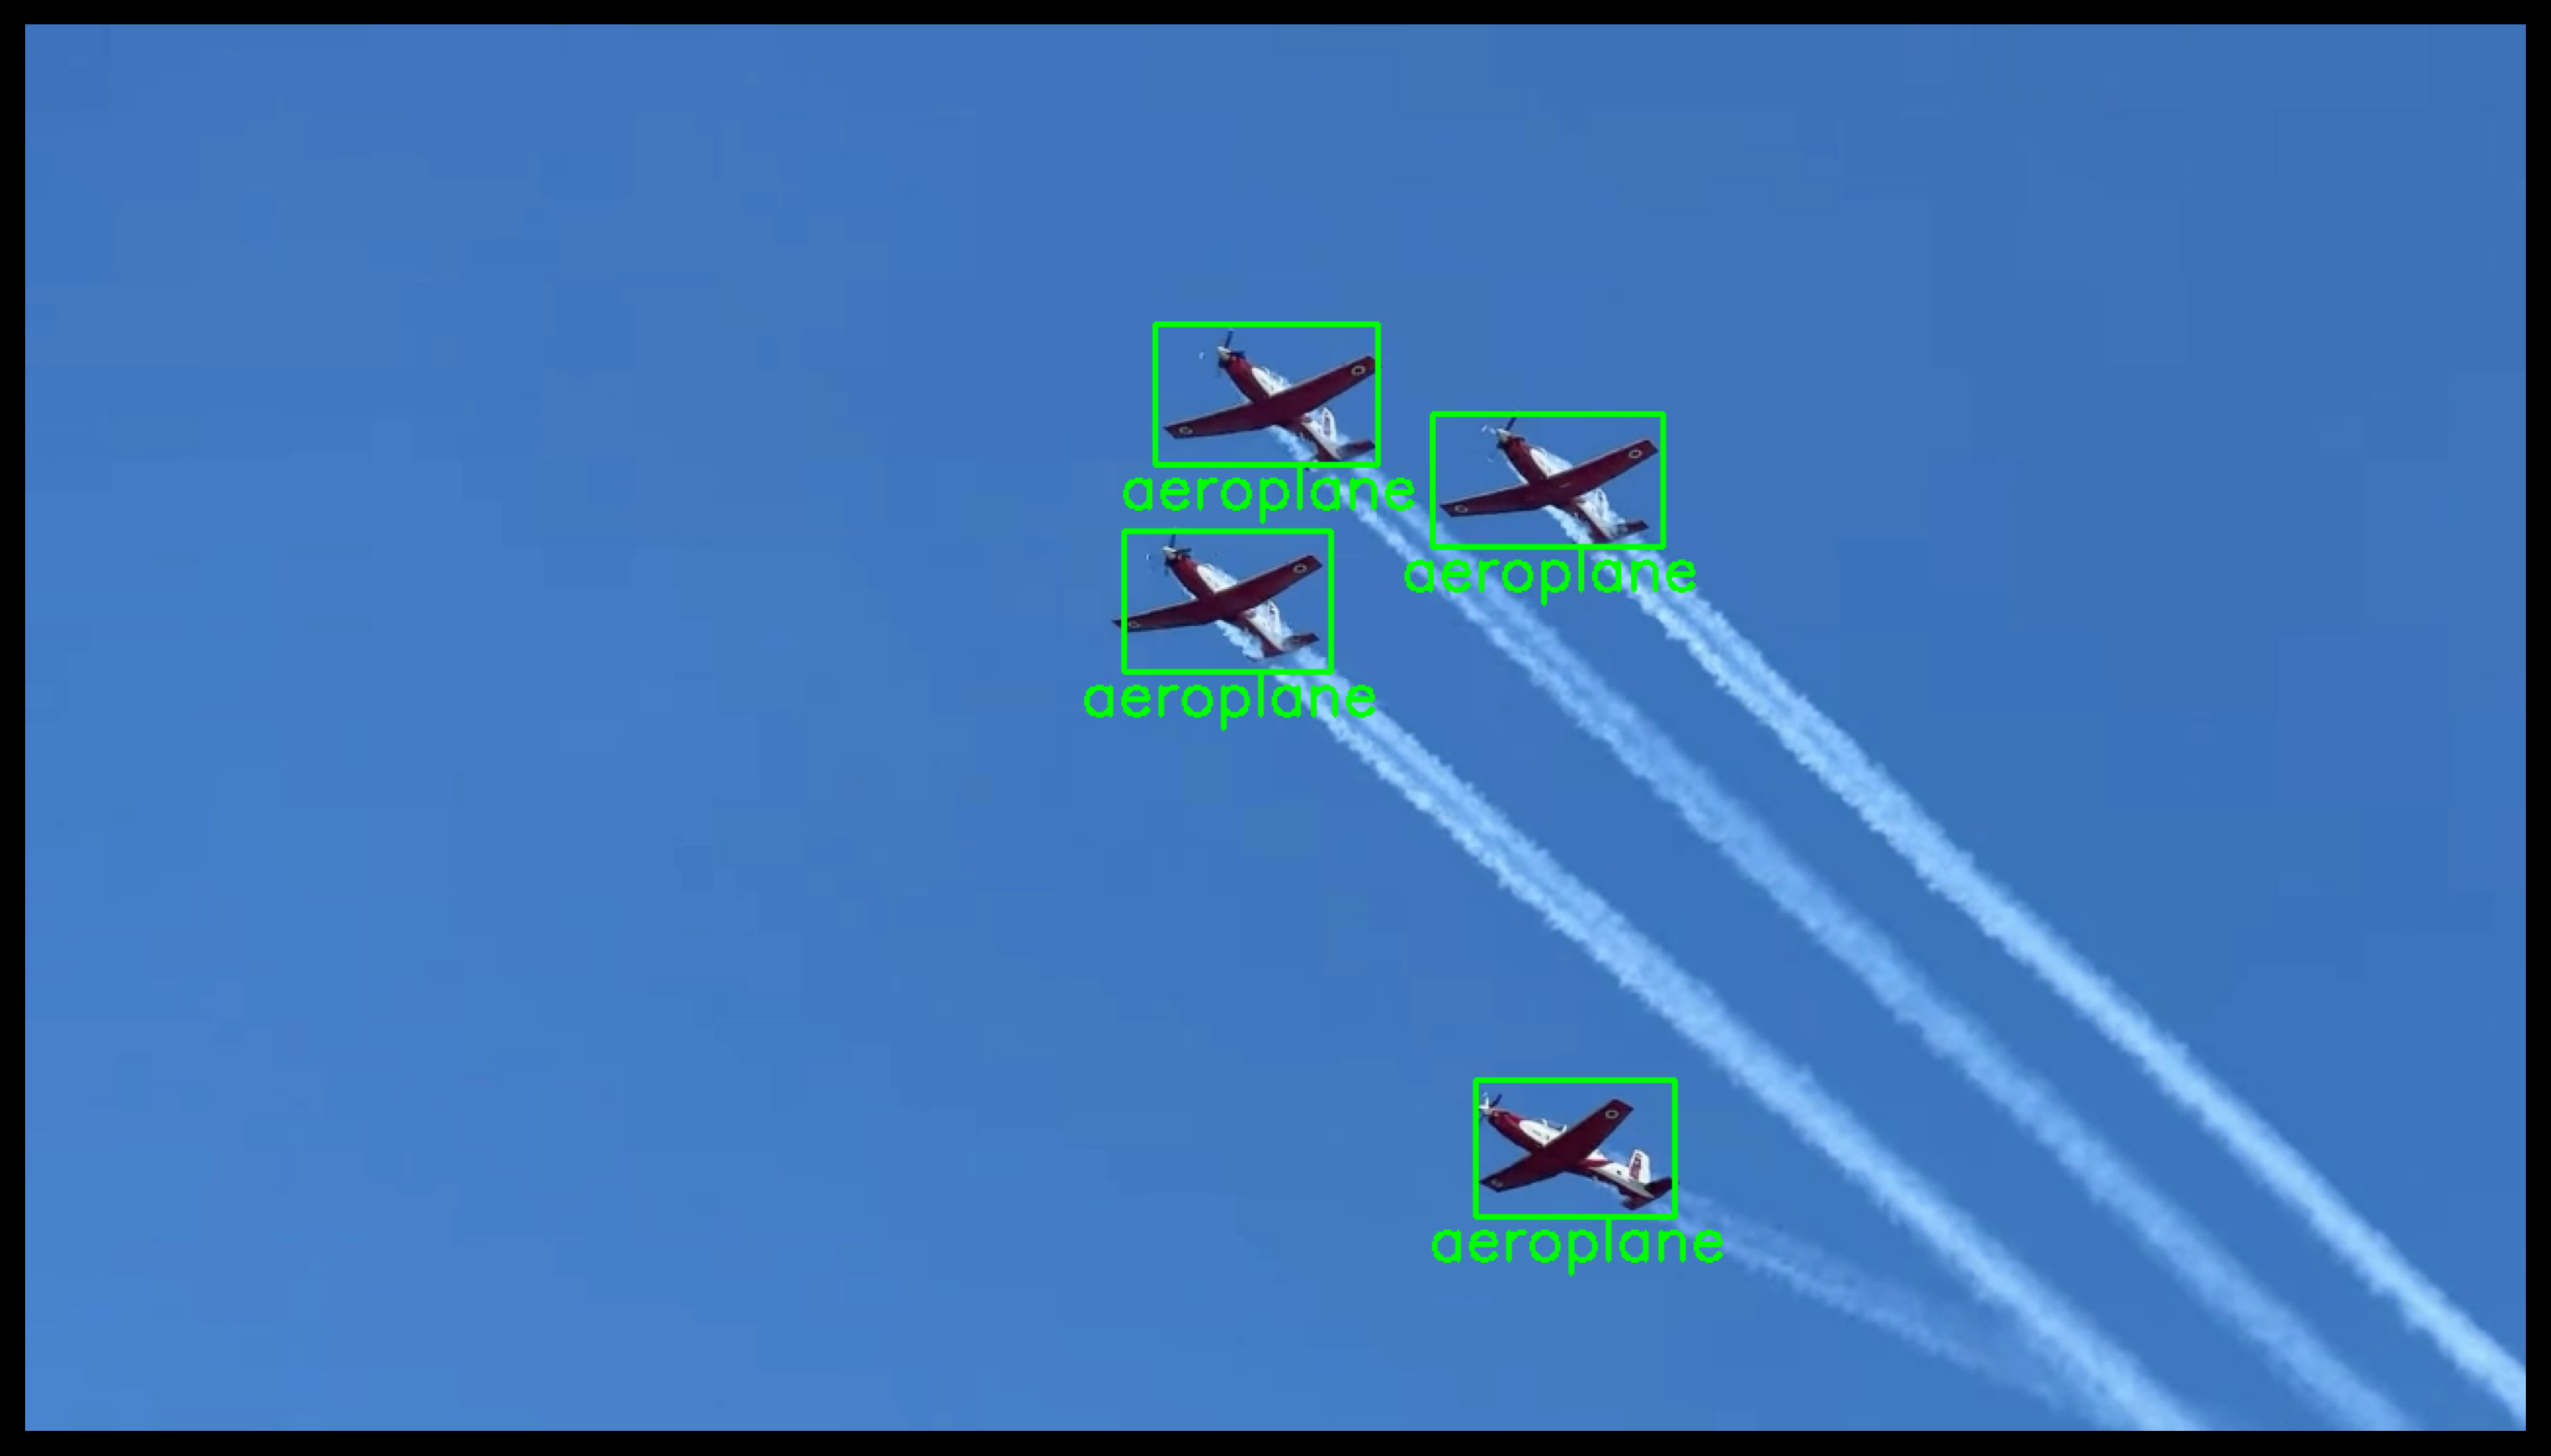
Object detection in a single frame
>>> img = cv2.imread(impath)
>>> pts = yolo3.detect(img)
>>> for p in pts:
...   cv2.rectangle(img, p.box[0], p.box[1], [0, 255, 0], 2)
>>> plt.figure()
>>> plt.axis(False)
>>> plt.imshow(cv2.cvtColor(img, cv2.COLOR_BGR2RGB))
Object detection in a video
>>> video_cap = cv2.VideoCapture(vidpath)
>>> while video_cap.isOpened():
...   ret, frame = video_cap.read()
...   if not ret: break
...   pts = yolo3.detect(frame)
...   for p in pts:
...     cv2.rectangle(frame, p.box[0], p.box[1], [0, 255, 0], 2)
...     cv2.imshow('YOLOv3', frame)
...   cv2.waitKey(10)
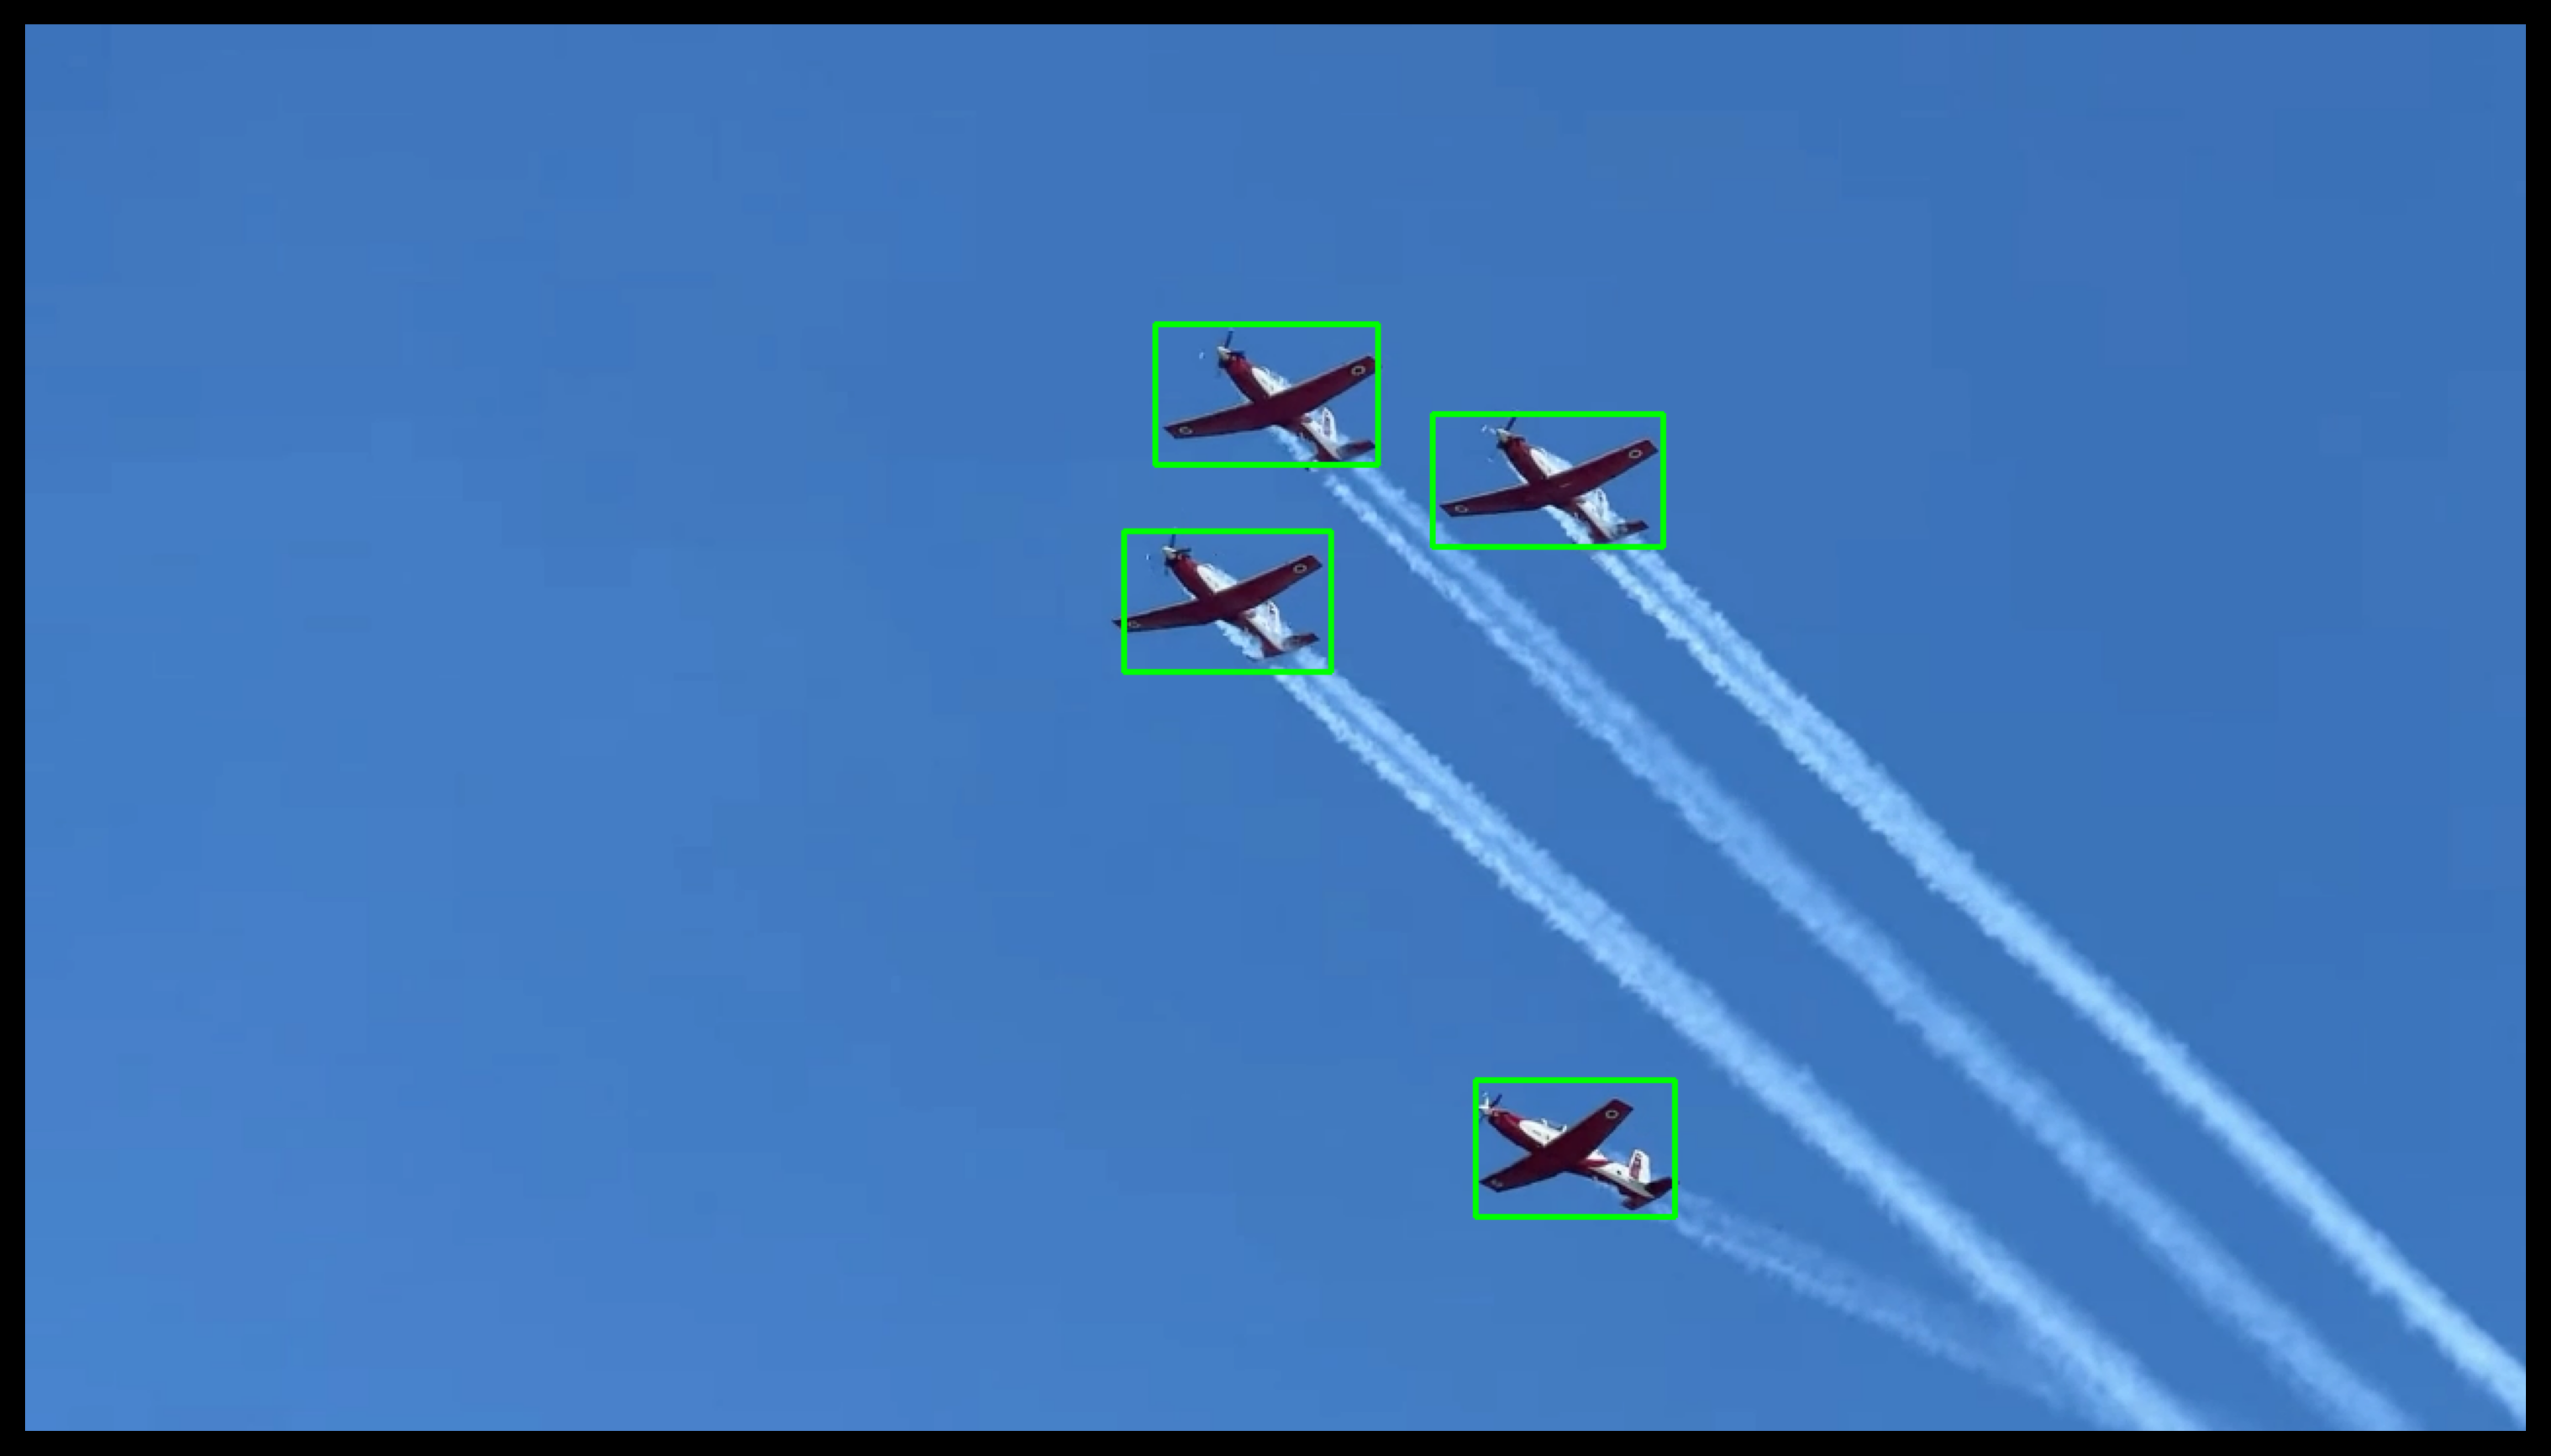
The output structure
The output of the detect() function is a list of
pixelpointobject. Thepixelpointhas unique attributes to manipulate the detected object class and bounding box.>>> print('{:^10} | {:^10} | {:^10} | {:^16} | {:^16} | {:^10} | {:^14}' ... .format('# object', 'center x', 'center y', 'box top-left', 'box bottom-right', 'class', 'frame size')) >>> # main loop: >>> for i, p in enumerate(pts): ... print('{:^10d} | {:^10.3f} | {:^10.3f} | {:^16} | {:^16} | {:^10} | {:^14}' ... .format(i, p.x, p.y, ptup(p.box[0]), ptup(p.box[1]), p.class_id, ptup(p.fsize))) ... cv2.rectangle(img, p.box[0], p.box[1], [0, 0, 0], 2) ... point = (int((p.box[0][0] + p.box[1][0]) / 2 - 75), p.box[1][1] + 22) ... cv2.putText(img, p.class_id, point, cv2.FONT_HERSHEY_SIMPLEX, 1, [0, 0, 0], 2) # object | center x | center y | box top-left | box bottom-right | class | frame size 0 | 0.584 | 0.376 | (691, 234) | (802, 306) | aeroplane | (1280, 720) 1 | 0.457 | 0.473 | (528, 305) | (642, 376) | aeroplane | (1280, 720) 2 | 0.471 | 0.322 | (542, 196) | (661, 267) | aeroplane | (1280, 720) 3 | 0.546 | 0.873 | (645, 588) | (752, 668) | aeroplane | (1280, 720)
>>> plt.figure()
>>> plt.axis(False)
>>> plt.imshow(cv2.cvtColor(img, cv2.COLOR_BGR2RGB))