c4dynamics.utils.plottools.plotdefaults#
- c4dynamics.utils.plottools.plotdefaults(ax, title, xlabel='', ylabel='', fontsize=8, ilines=None)[source]#
Setting default properties on a matplotlib axis.
- Parameters:
ax (matplotlib.axes.Axes) – The matplotlib axis on which to set the properties.
title (str) – Plot title.
xlabel (str) – The label for the x-axis.
ylabel (str) – The label for the y-axis.
fontsize (int, optional) – The font size for the title, x-axis label, y-axis label, and tick labels. Default is 14.
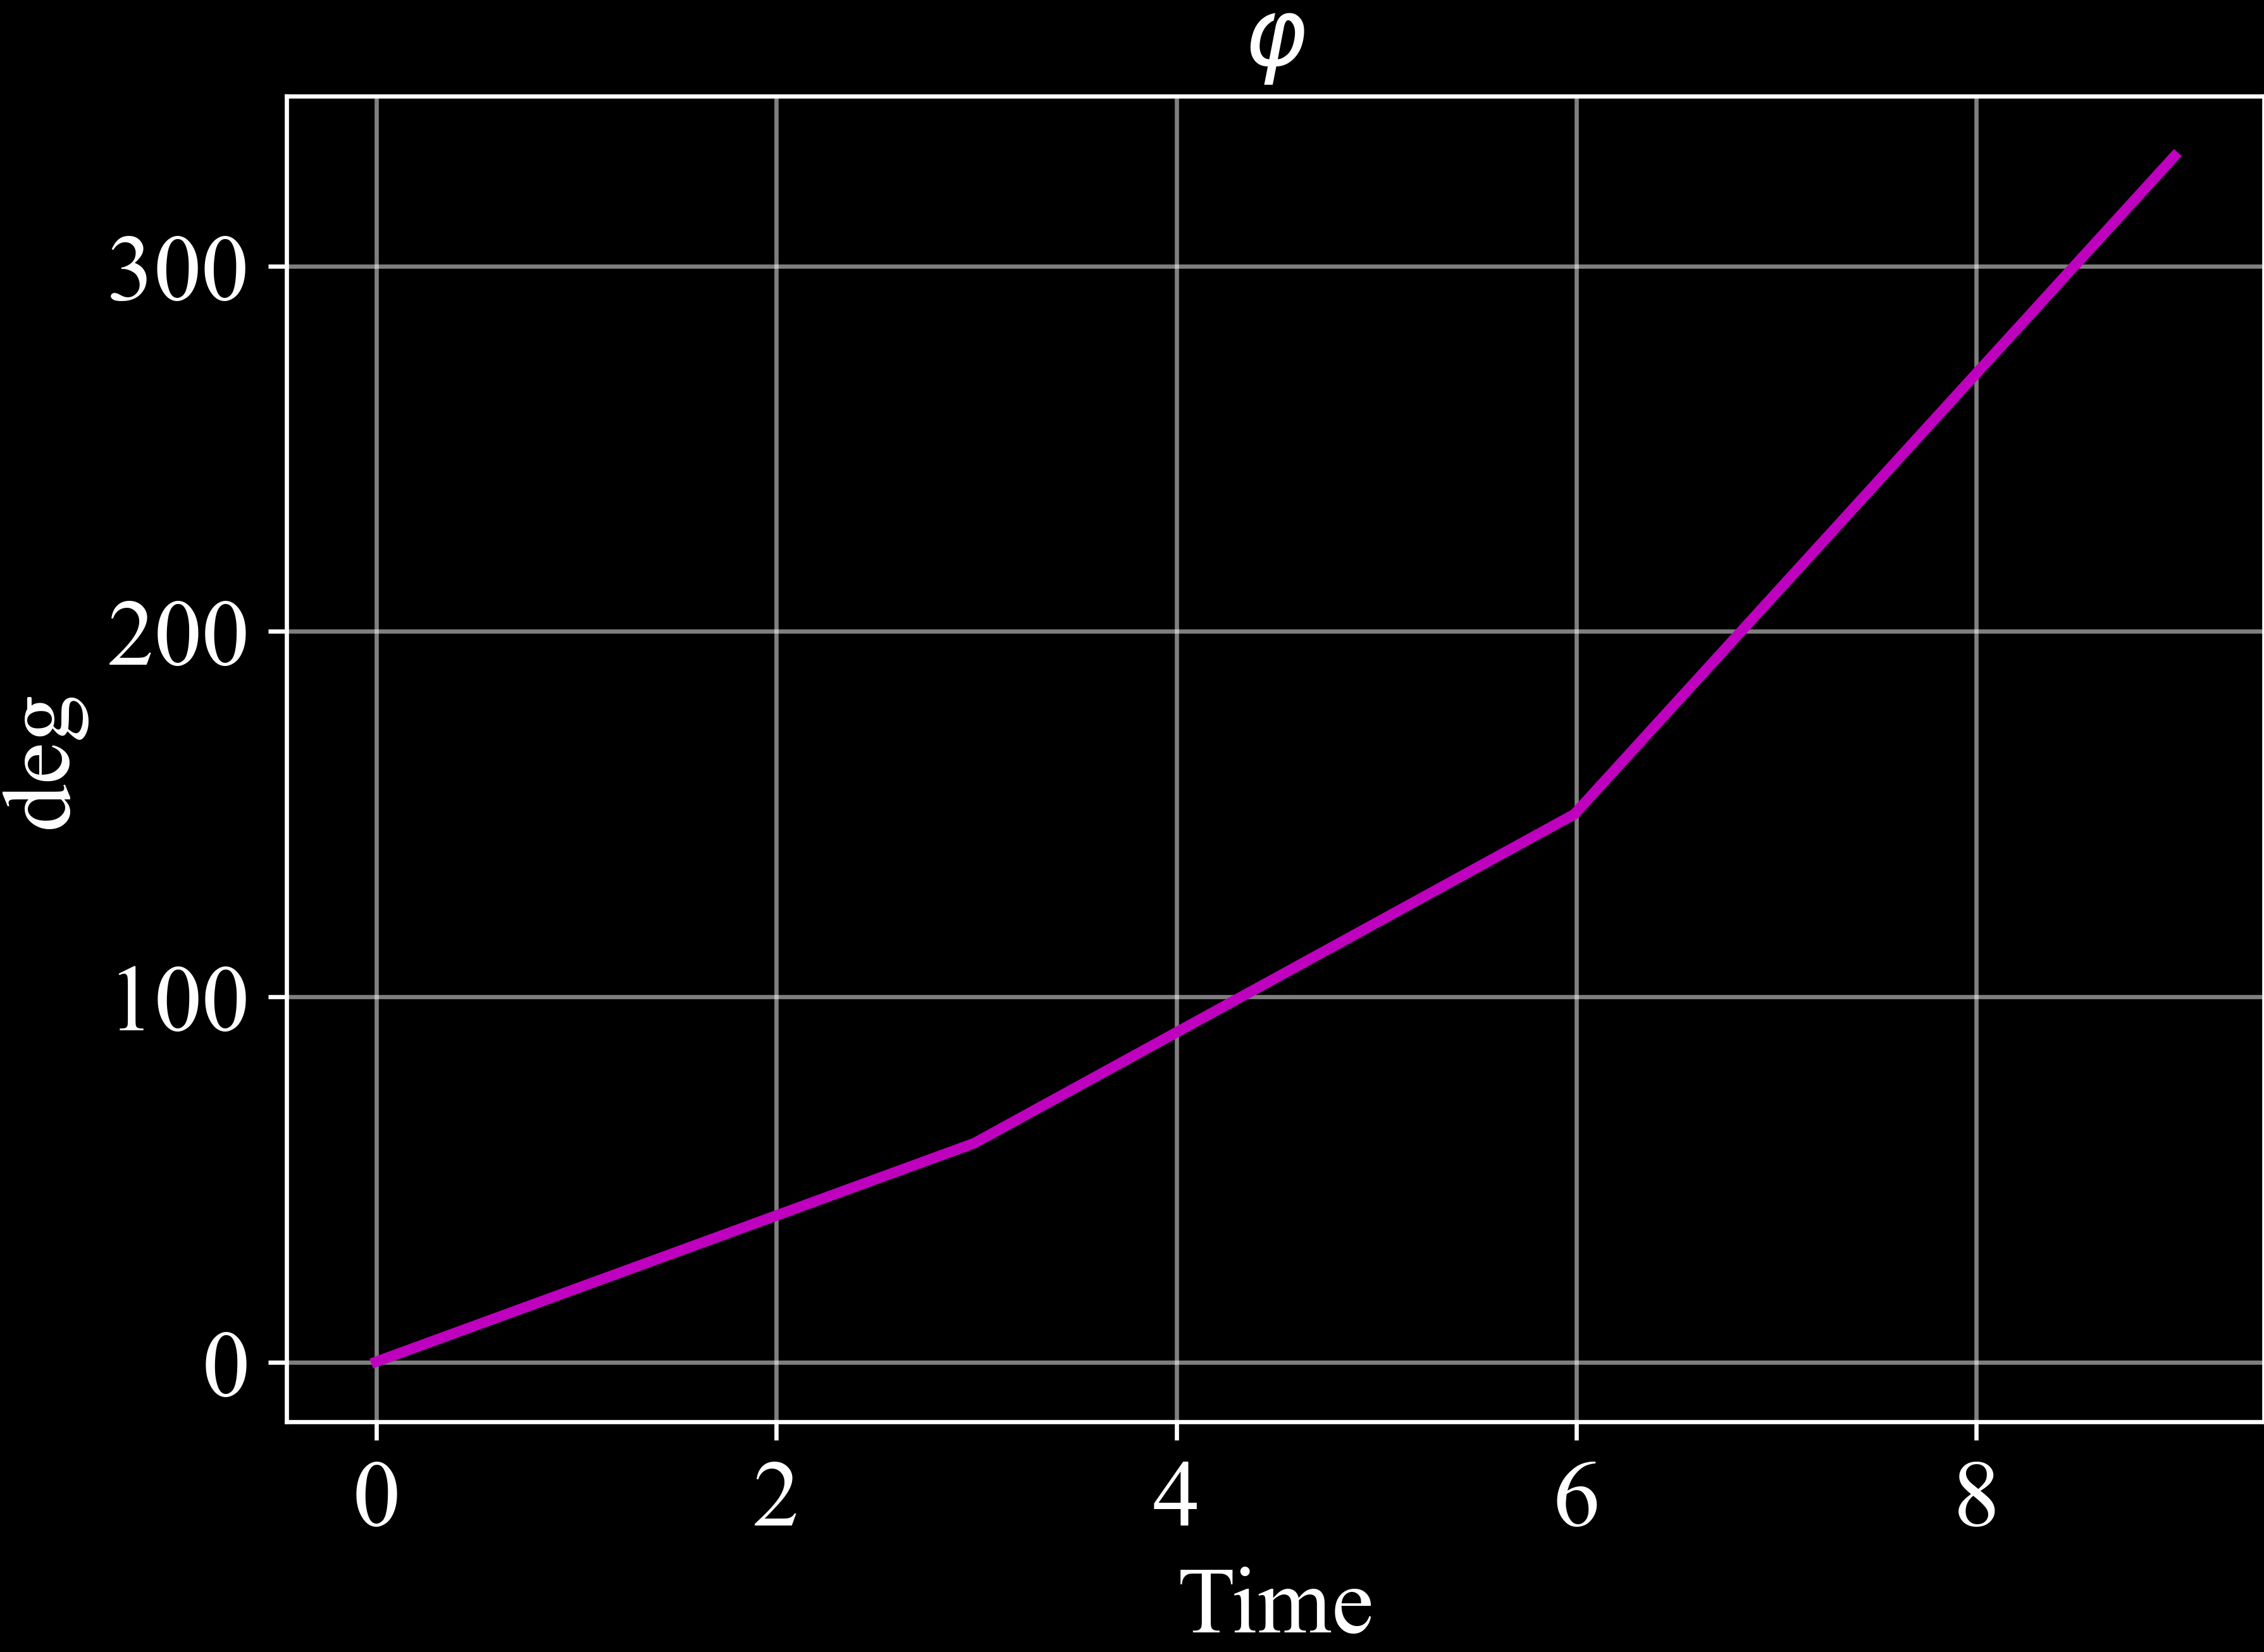
Example
>>> import c4dynamics as c4d
>>> f16 = c4d.rigidbody()
>>> dt = .01
>>> for t in np.arange(0, 9, dt):
...   if t < 3:
...     f16.phi += dt * 180 / 9 * c4d.d2r
...   elif t < 6:
...     f16.phi += dt * 180 / 6 * c4d.d2r
...   else:
...     f16.phi += dt * 180 / 3  * c4d.d2r
...   f16.store(t)
>>> ax = plt.subplot()
>>> ax.plot(*f16.data('phi', c4d.r2d), 'm', linewidth = 2)
>>> c4d.plotdefaults(ax, '$\varphi$', 'Time', 'deg', fontsize = 18)