Pixelpoint#
- class c4dynamics.states.lib.pixelpoint.pixelpoint(x=0, y=0, w=0, h=0)[source]#
A data point in a video frame with a bounding box.
pixelpointis a data structure for managing object detections in tracking missions. It provides properties and methods to conveniently interact with computer vision modules.The pixelpoint state variables are the object center and the bounding box:
\[X = [x, y, w, h]^T\]Center pixel, bounding box size.
Arguments
- xfloat or int
The x-coordinate of the center of the object.
- yfloat or int
The y-coordinate of the center of the object.
- wfloat or int
The width of the bounding box.
- hfloat or int
The height of the bounding box.
These variables use for streamlined operations through the state vector
X.Parameters define the object and are not part of the state. For the pixelpoint class these are the frame size and the object classification.
- Parameters:
fsize ((int, int)) – Frame size in pixels.
class_id (str) – Class label associated with the object.
Construction
A pixelpoint instance is typically created when a new object is detected.
For a given detection d with the following indices:
[0] : x-center, pixels
[1] : y-center, pixels
[2] : width, pixels
[3] : height, pixels
[4:end] : probabilities for each class of the list class_names
and for frames with dimensions (f_width, f_height), the following snippet constructs a pixelpoint and updates its properties.
Import packages:
>>> from c4dynamics import pixelpoint
>>> import numpy as np
Given a detection with arbitrary values:
>>> d = [50, 50, 15, 25, 0.8, 0.1, 0.0, 0.05, 0.89]
>>> f_width, f_height = 100, 100
>>> class_names = ['dog', 'cat', 'horse', 'fox']
Initialize a pixelpoint instance with the input detection:
>>> pp = pixelpoint(x = d[0], y = d[1], w = d[2], h = d[3])
>>> pp.fsize = (f_width, f_height)
>>> pp.class_id = class_names[np.argmax(d[5:])]
Examples
Setup and Preliminaries
Import required packages:
>>> import cv2  # opencv-python
>>> import numpy as np
>>> import c4dynamics as c4d
>>> from matplotlib import pyplot as plt
Fetch ‘planes.png’ and ‘triangle.png’ using the c4dynamics’ datasets module (see
c4dynamics.datasets):>>> tripath = c4d.datasets.image('triangle') Fetched successfully >>> planspath = c4d.datasets.image('planes') Fetched successfully
Define two auxiliary functions. The first, tridetect(), returns bounding boxes of the detected triangles:
>>> def tridetect(img):
...   _, thresh = cv2.threshold(cv2.cvtColor(img, cv2.COLOR_BGR2GRAY), 50, 255, 0)
...   contours, _ = cv2.findContours(thresh, cv2.RETR_EXTERNAL, cv2.CHAIN_APPROX_SIMPLE)
...   bbox = []
...   for contour in contours:
...     approx = cv2.approxPolyDP(contour, 0.01 * cv2.arcLength(contour, True), True)
...     if len(approx) == 3:
...       bbox.append(cv2.boundingRect(contour))
...   return bbox
The second function, ptup, converts a tuple of two numbers into a formatted string:
>>> def ptup(n):
...   return '(' + str(n[0]) + ', ' + str(n[1]) + ')'
Construction from image
>>> img = cv2.imread(tripath)
>>> pp = c4d.pixelpoint(x = int(img.shape[1] / 2), y = int(img.shape[0] / 2), w = 100, h = 100)
>>> pp.fsize = img.shape[:2]
>>> pp.class_id = 'triangle'
Construction from detection
Given a frame with dimensions (f_width, f_height) and a detection d from an object detector:
>>> pp = c4d.pixelpoint(x = d[0], y = d[1], w = d[2], h = d[3])
>>> pp.fsize = (f_width, f_height)
>>> pp.class_id = class_names[np.argmax(d[5:])]
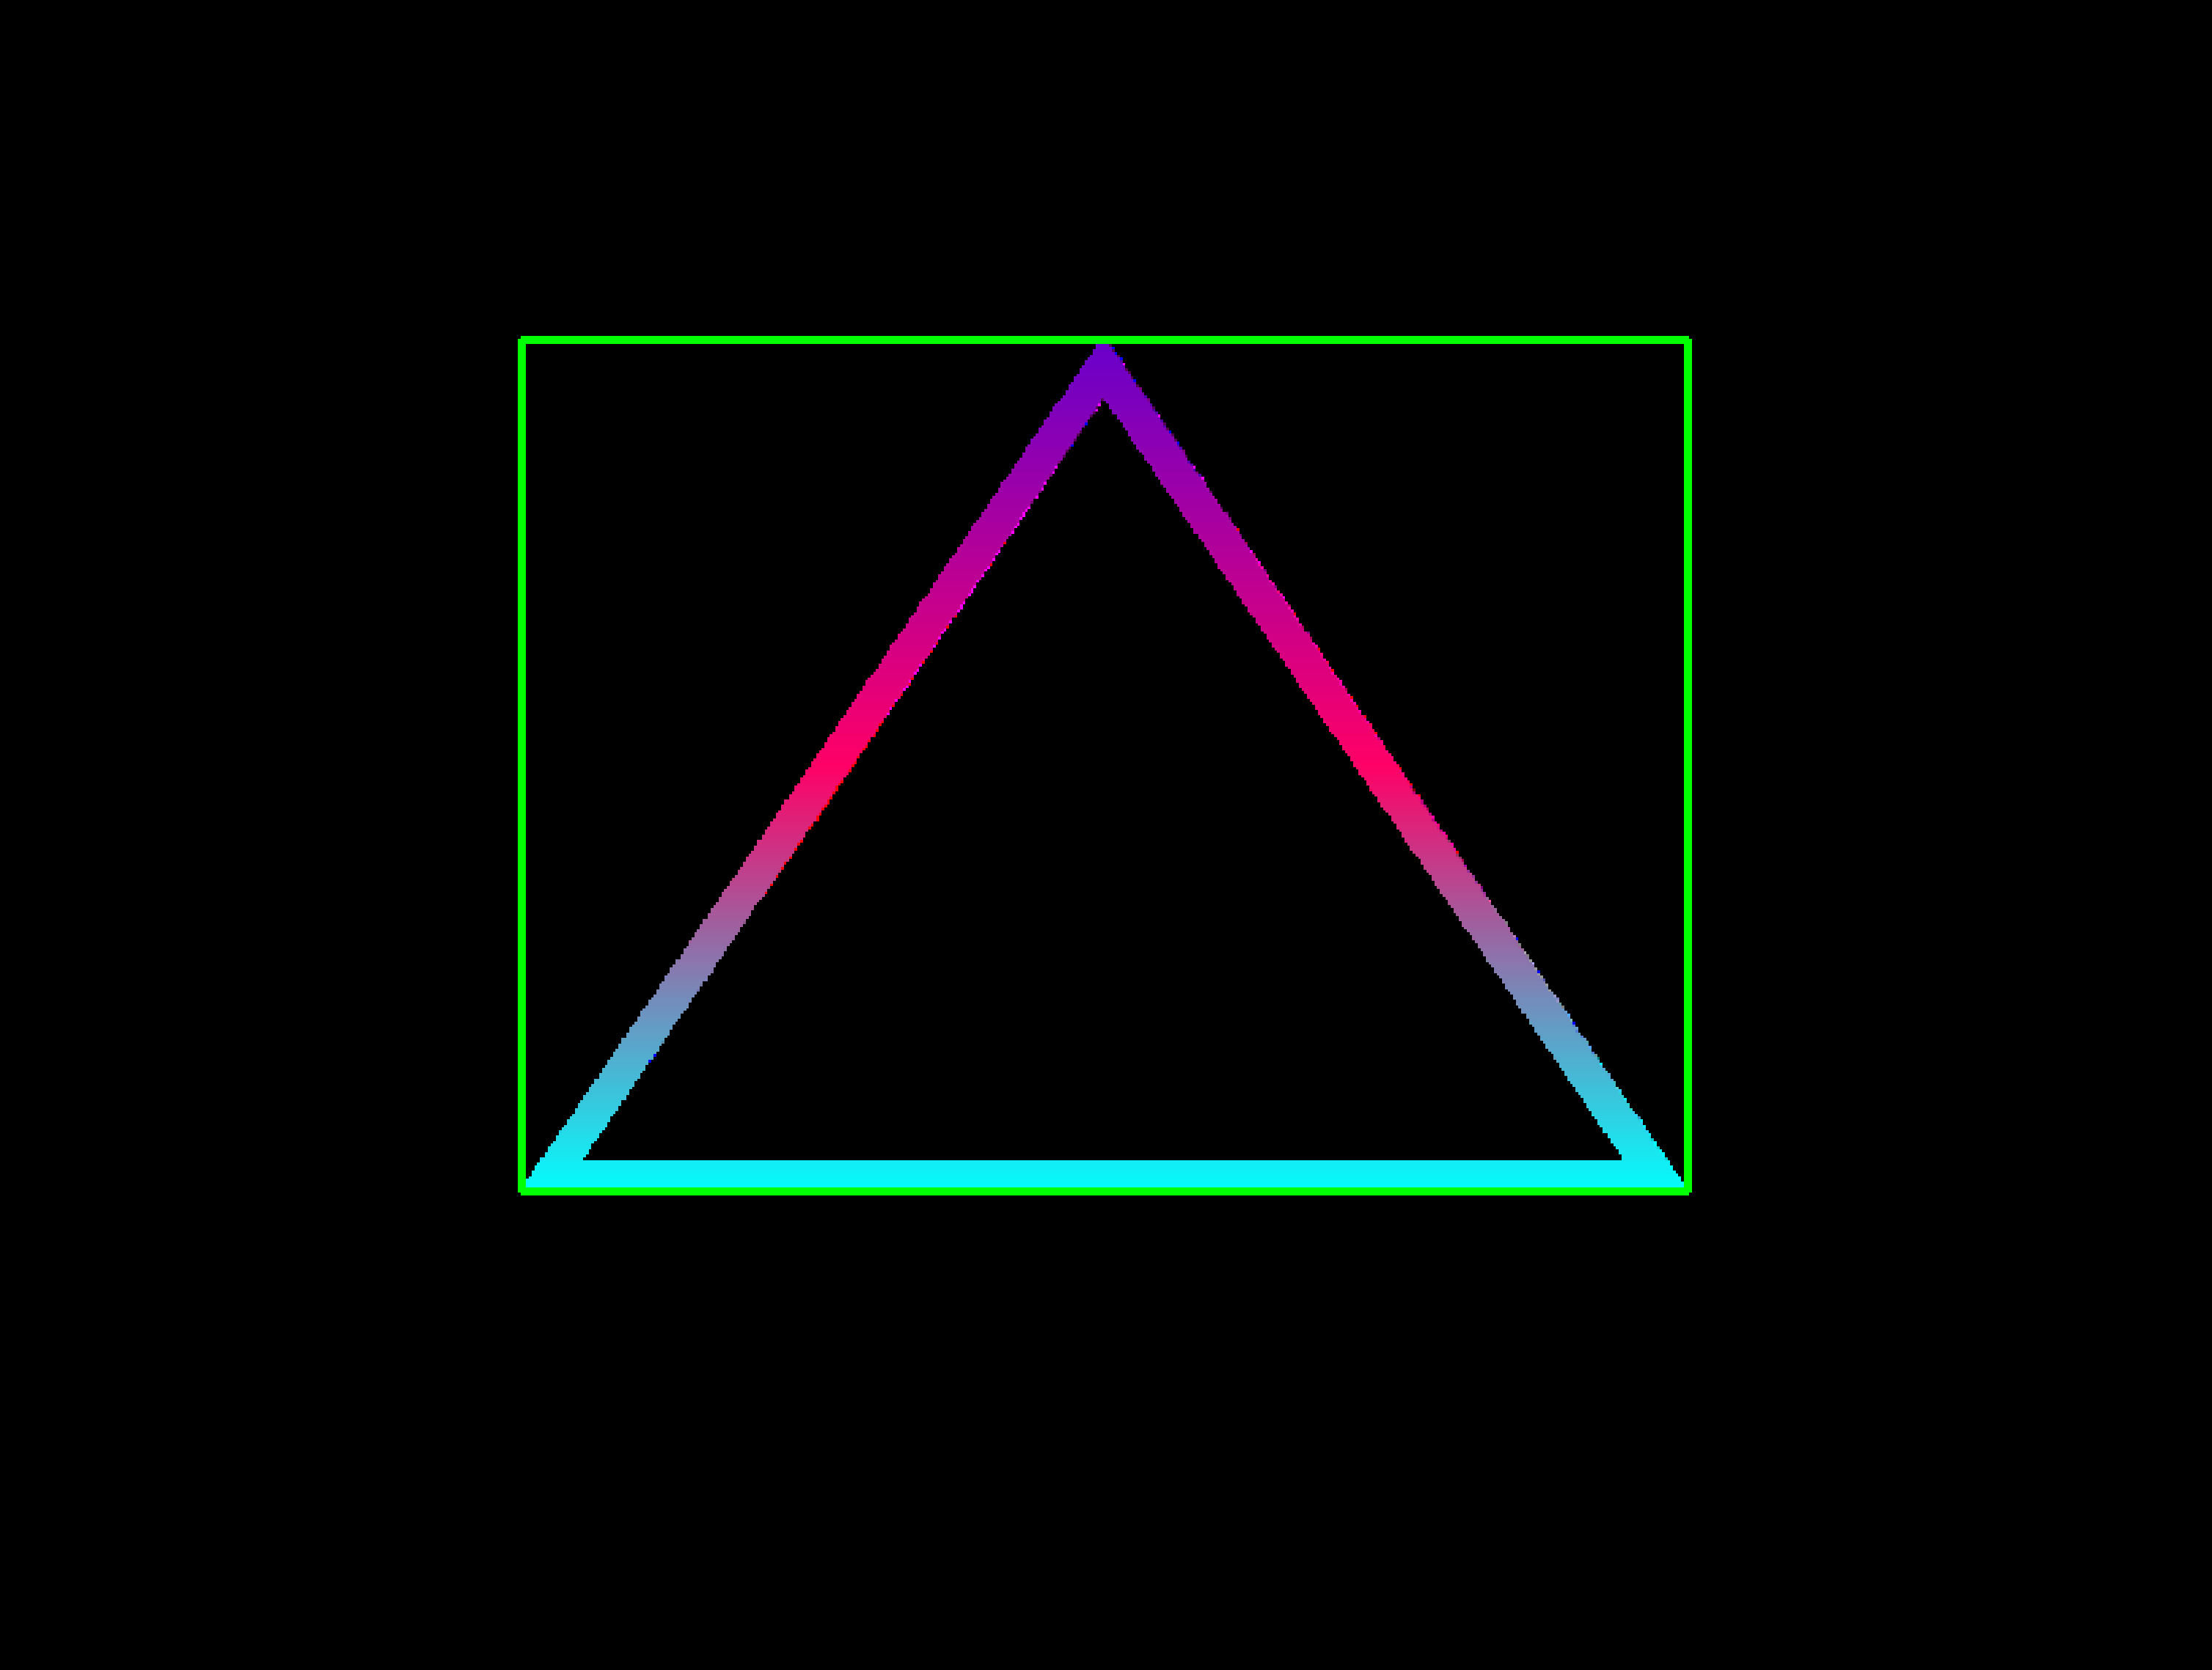
Triangles detection
Run a triangles detector and create a pixelpoint object per each detected triangle. Use
boxto draw bounding boxes:>>> img = cv2.imread(tripath) >>> triangles = tridetect(img)
>>> print('{:^10} | {:^10} | {:^16} | {:^16} | {:^10} | {:^14}'.format('center x', 'center y', 'box top-left', 'box bottom-right', 'class', 'frame size'))
>>> # iterate over the detected triangles:
>>> for tri in triangles:
...   pp = c4d.pixelpoint(x = int(tri[0] + tri[2] / 2), y = int(tri[1] + tri[3] / 2), w = tri[2], h = tri[3])
...   pp.fsize = img.shape[:2]
...   pp.class_id = 'triangle'
...   print('{:^10d} | {:^10d} | {:^16} | {:^16} | {:^10} | {:^14}'.format(pp.x, pp.y, ptup(pp.box[0]), ptup(pp.box[1]), pp.class_id, ptup(pp.fsize)))
...   cv2.rectangle(img, pp.box[0], pp.box[1], [0, 255, 0], 2)
center x  |  center y  |   box top-left   | box bottom-right |   class    |   frame size
  399     |    274     |    (184, 117)    |    (614, 431)    |  triangle  |   (600, 800)
>>> plt.figure()
>>> plt.axis(False)
>>> plt.imshow(cv2.cvtColor(img, cv2.COLOR_BGR2RGB))
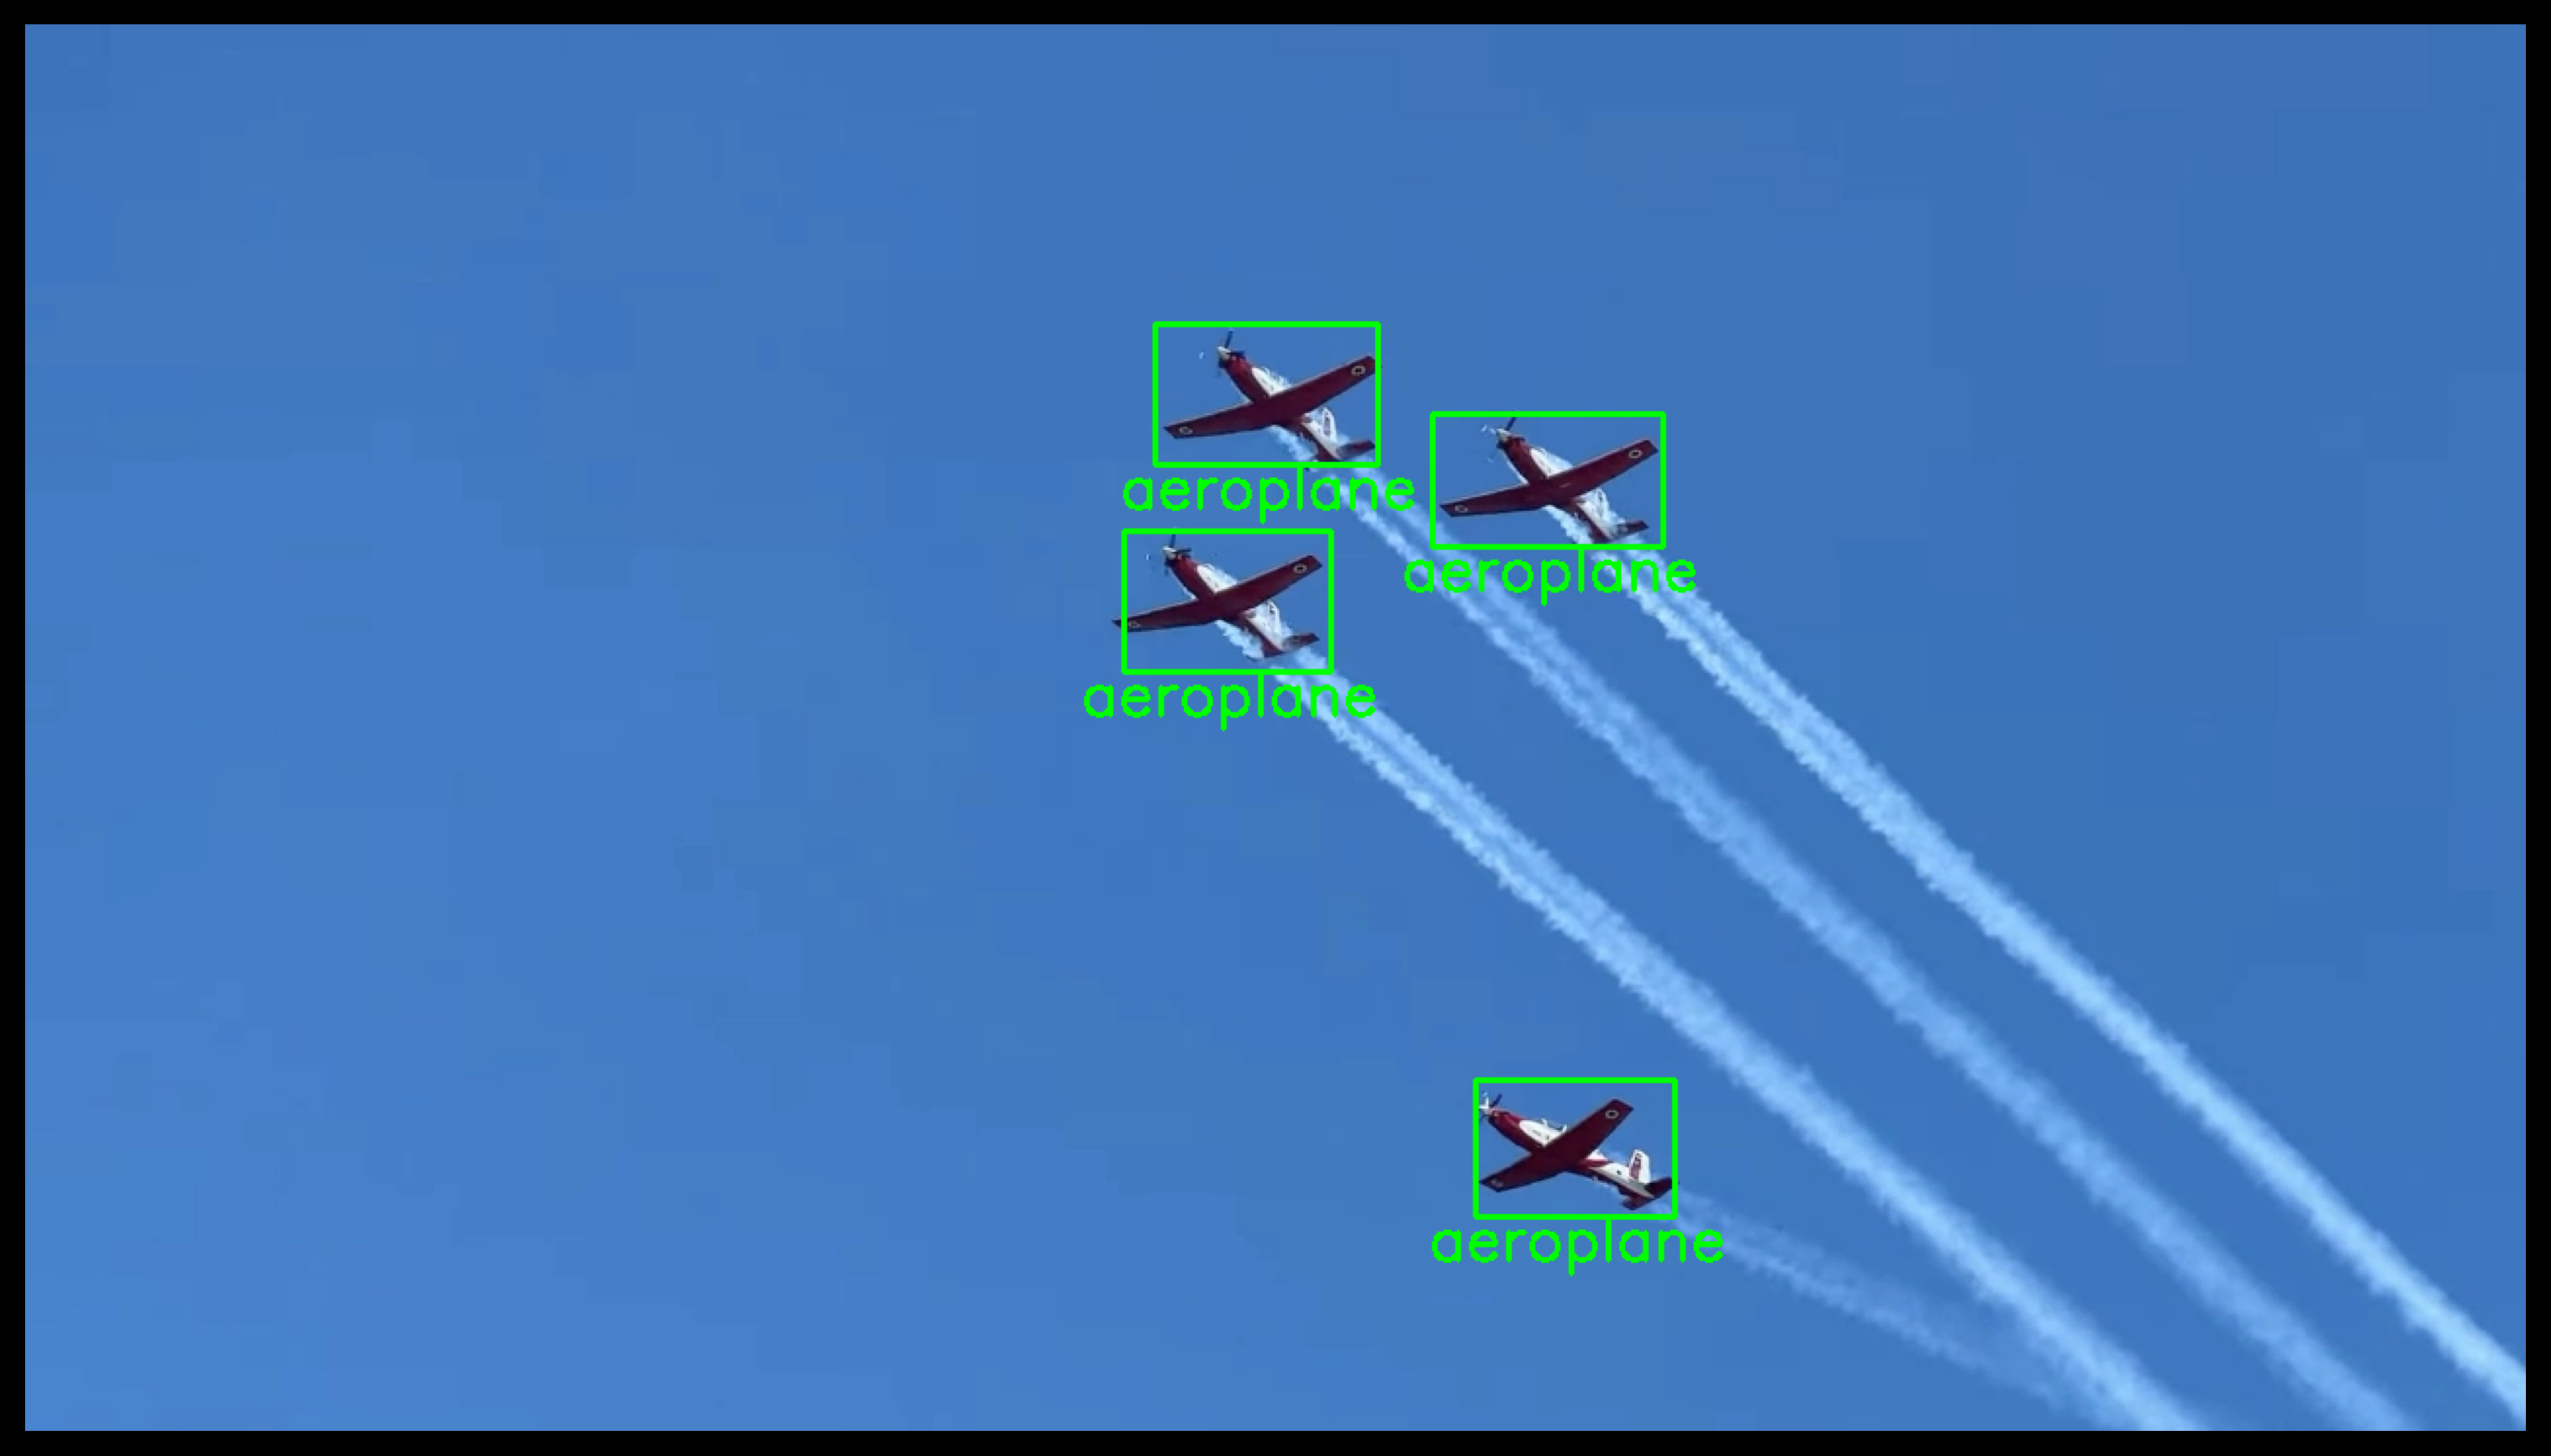
C4dynamics’ YOLOv3 detector
The method
detectof the classyolov3returns a list of pixelpoint for the detected objects in an image. Print the output per a detected object and view the final image:>>> img = cv2.imread(planspath) >>> yolo3 = c4d.detectors.yolov3() Fetched successfully >>> pts = yolo3.detect(img)
>>> # prepare for printing properties:
>>> print('{:^10} | {:^10} | {:^16} | {:^16} | {:^10} | {:^14}'.format('center x', 'center y', 'box top-left', 'box bottom-right', 'class', 'frame size'))
>>> for p in pts:
...   print('{:^10d} | {:^10d} | {:^16} | {:^16} | {:^10} | {:^14}'.format(p.x, p.y, ptup(p.box[0]), ptup(p.box[1]), p.class_id, ptup(p.fsize)))
...   cv2.rectangle(img, p.box[0], p.box[1], [0, 255, 0], 2)
...   point = (int((p.box[0][0] + p.box[1][0]) / 2 - 75), p.box[1][1] + 22)
...   cv2.putText(img, p.class_id, point, cv2.FONT_HERSHEY_SIMPLEX, 1, [0, 255, 0], 2)
center x  |  center y  |   box top-left   | box bottom-right |   class    |  frame size
  615     |    295     |    (562, 259)    |    (668, 331)    | aeroplane  |  (1280, 720)
  779     |    233     |    (720, 199)    |    (838, 267)    | aeroplane  |  (1280, 720)
  635     |    189     |    (578, 153)    |    (692, 225)    | aeroplane  |  (1280, 720)
  793     |    575     |    (742, 540)    |    (844, 610)    | aeroplane  |  (1280, 720)
>>> plt.figure()
>>> plt.axis(False)
>>> plt.imshow(cv2.cvtColor(img, cv2.COLOR_BGR2RGB))
Properties
Gets and sets the frame size.
Gets and sets the object classification.
Returns the box coordinates.